Contents
- 1. What is fishbone diagram?
- 2. What is a fishbone diagram composed?
- 3. How many types of fishbone diagram are for water bottle quality management?
- 4. How to make a fishbone diagram?
- 4.1 Analyzing problem causes/structures
- 4.2 Draw the fishbone diagram
- 5. What are the key points for making a fishbone diagram?
- 6. How to make a fishbone diagram for water quality management?
- 7. Conclusion
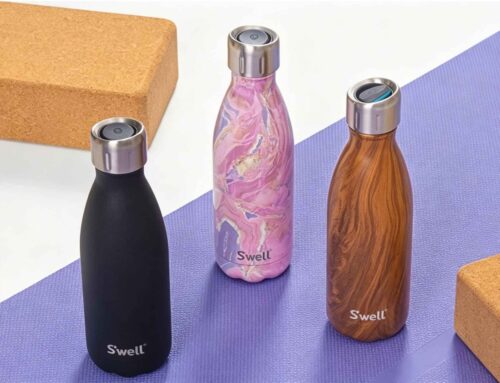
As a leading wholesale custom water bottle manufacturer, KingStar’s insulated water bottles are of excellent quality and stability. One of the key reasons is our company’s using the fishbone diagram as a quality management tool to analyze and resolve various quality issues encountered in wholesale water bottle manufacturing. Just as Dr. Ishikawa said, think of at least four factors which influence your problem and see if a shift in one of these causes can give you a different effect to explore. We care about every detail appearing during manufacturing, trying our best to ensure the final quality of every water bottle. In the following, we will provide you a detailed introduction to the fishbone diagram, which is one of the seven major tools in quality management.
1. What is fishbone diagram?
The fishbone diagram, also called as Ishikawa diagram, cause-and-effect diagram or herringbone diagram, is a method for identifying the root causes of problems. Quality issues with water bottles are often influenced by various factors. Through brainstorming, we identify these factors and organize them in a hierarchical and organized manner, along with their corresponding characteristic values. This graphical representation, highlighting important factors, is called a cause-and-effect diagram or fishbone diagram due to its resemblance to a fishbone. It is an analytical method that allows us to see the essence through phenomena, and it is also known as cause-and-effect diagram.
2. What is a fishbone diagram composed?

Just as the picture shows that a fishbone diagram for water bottle management is mainly comosed with two parts: fish head and several fish bones. Each part has its own function:
- Fish head:The head of the fishbone diagram represents the main problem or outcome being analyzed. It is typically drawn as a box or oval at the right side of the diagram.
- Fish bones:The bones of the fishbone diagram are the main categories or factors that contribute to the problem or outcome. These categories are typically represented as lines that branch out from the head of the diagram. As the fishbone diagram is also called as the “5M1E Factor Analysis Method”, there are usually five bones appearing in a diagram, representing five factors: man, machine, material, method, measurement and environment.
Man: People involved in the process.
Methods: Procedures, rules, or processes followed.
Machines: Equipment, tools, or technology used.
Materials: Raw materials, supplies, or resources utilized.
Measurement: Solutions and actions for finding problems.
Environment:Physical or external factors influencing the process.
Each bone category can further be divided into more specific subcategories or factors. These subcategories are represented as smaller lines branching out from the main bone category lines. On the branches of the diagram, specific causes or factors that contribute to the problem or outcome are written. These causes can be identified through brainstorming, data analysis, or other problem-solving techniques. The diagram visually displays the relationships and connections between different causes and their potential impact on the problem.
By using a fishbone diagram, teams can systematically analyze and identify the root causes of a problem, enabling them to develop effective solutions and improve processes or outcomes.Based on these five elements, the diagram helps identify potential causes within each element. Additionally, the fishbone diagram is also used in depicting the process flow of water bottle manufacturing, providing a visual representation of the production workshop’s processes.

Click and read more: Titanium Water Bottle Manufacturer
3. How many types of fishbone diagram are for water bottle quality management?
Based on different focus, fishbone diagrams can be classified into three types:
- Structured Problem Fishbone Diagram: A structured problem fishbone diagram, as the name implies, aims to organize and structure the problem at hand. It emphasizes the relationships between various elements, rather than causal relationships. Generally, by utilizing a structured problem fishbone diagram, one can organize and summarize the problem effectively. Additionally, it allows for brainstorming sessions to analyze and classify the problem, thereby supplementing potential solutions.

Here is an example of using structured problem fishbone diagram to analyze the relationship among elements for a healthy lifestyle.
- Cause-and-Effect Fishbone Diagram: In a cause-and-effect fishbone diagram, the fish head is typically positioned on the right side, representing the result or effect. The fishbone, on the other hand, is on the left side, indicating the causes. The analysis process usually starts from the middle of the fishbone, where the problem is thoroughly examined and analyzed layer by layer. By conducting a detailed analysis of the problem, the main issues can be identified and addressed effectively. The characteristic questioning used in this type of diagram is often “Why?” to uncover the underlying causes and contributing factors.

- Countermeasure Fishbone Diagram: In a countermeasure fishbone diagram, the fish head is generally positioned on the left side, representing the desired outcome or result. The fishbone branches on the right side signify the countermeasures or solutions, expressed using terms like “improve”or “” The primary purpose of this type of diagram is to identify measures that can help raise standards and improve the problem at hand. When creating a countermeasure fishbone diagram, it is important to enrich the fishbone with diverse and varied countermeasures. This allows for a comprehensive exploration of possible solutions to the problem. By including a range of different strategies and approaches, a more comprehensive understanding of how to address the problem can be achieved.

As for the water bottle quality management, we tend to use cause-and-effect fishbone diagram to deal with numerous problems in the manufacturing process.
4. How to make a fishbone diagram?
The creation of a fishbone diagram involves two steps: analyzing the problem causes/structure and drawing the fishbone diagram.
4.1 Analyzing problem causes/structures
This is a crucial step in creating a fishbone diagram. It helps us identify root causes, organize information, uncover interdependencies, prioritize solutions, and prevent recurrence while encountering various problems in producing water bottle. This step ensures a comprehensive understanding of the problem and enables effective problem-solving. Here we will show you detailed tips:
- Define the problems and determine the major categories: Identify the problem areas and choose a hierarchical approach. In water bottler manufacturing process, we usually adopt six factors “man, machine, material, method, environment and measurement” to categorize them.
- Brainstorm:Conduct brainstorming sessions to identify all possible causes (factors) for each category in the hierarchy. Within each category, brainstorm as many potential causes as possible. We encourage team members or stakeholders to contribute their ideas. These causes will be used to populate the branches of the fishbone diagram.
- Organize and classify the identified factors: Take the potential causes identified in the previous step and organize these causes under their respective category branches on the fishbone diagram. This step helps clarify the relationships and dependencies between different factors.
- Analyze and select the significant factors: Review all the identified causes and analyze their significance in relation to the problem at hand. Consider the impact of each cause on the problem and its potential contribution to the issue. Then we select the most significant causes that are likely to have a substantial effect on the problem. These causes will be the focus of our subsequent problem-solving efforts.
- Review the description methods of each factor: For each cause listed on the fishbone diagram, review its description to ensure clear and concise language. We usually use simple and understandable terms to describe each cause and avoid jargon or technical language that might confuse others who are not familiar with the subject matter. Refine and clarify the descriptions if needed, making sure they accurately reflect the cause’s nature and its potential impact on the problem.
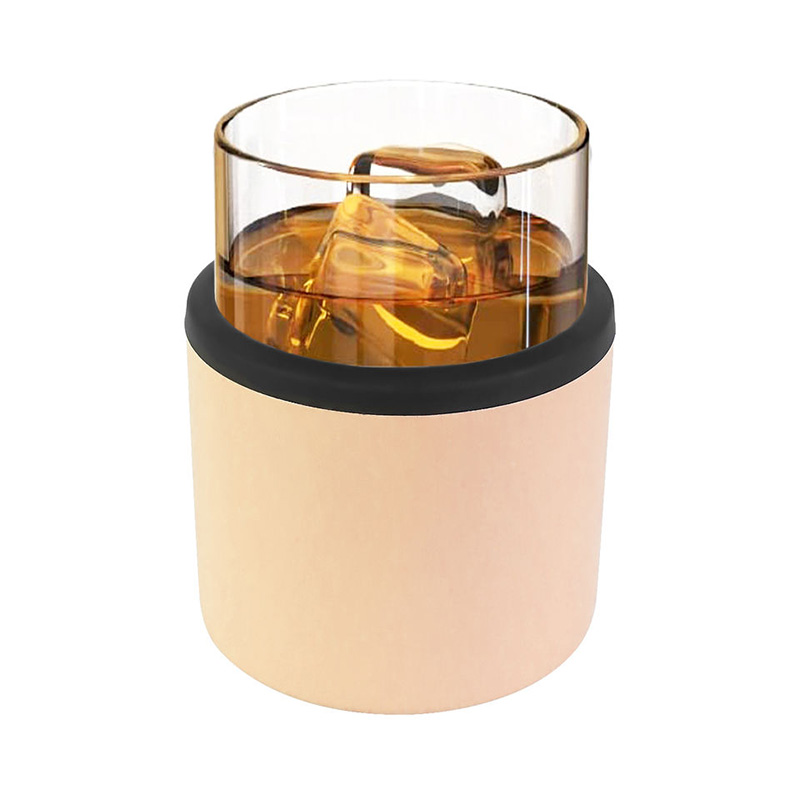
Wholesale Insulated Stainless Steel Sleeves for Whiskey Glass
Unit Price: USD 2.35-2.99
4.2 Draw the fishbone diagram
After a clear and comprehensive analysis of problem, it’s time to draw the fishbone diagram:
- Prepare a large blank sheet of paper or a whiteboard, or use software tools or online platforms that provide fishbone diagram templates.
- Draw a horizontal arrow pointing to the right in the center of the page. This arrow represents the “spine” of the fishbone diagram.
- Write the problem to be solved inthe head of fishbone diagram. This problem should be stated clearly and concisely.
- Draw six major bones(man, machine, material, method, environment and measurement) at a 60-degree angle from the main bone. These six major bones represent the six aspects of problem analysis “man, machine, material, method, environment, and measurement,” also known as the “5M1E” mentioned above.
- Gather for a meeting and conduct a brainstorming session specifically focused on the problem. Encourage the team to come up with as many possible causes as they can. During the process, avoid opposing or criticizing ideas. Compile and discuss all the identified causes, removing duplicates or irrelevant ones.
- Along each main branch, draw smaller diagonal lines known as sub-branches. These sub-branches will represent specific causes or factors within each category.
- Write down potential causes or factors that may contribute to the problem on the appropriate sub-branches. These causes should be specific and actionable for further analysis and problem-solving.
- Continue adding sub-branches and causes to the diagram until you have thoroughly identified and categorized the significant factors related to the problem.
- Review the completed fishbone diagram to ensure logical connections between causes and main branches and clear relationships between different factors.
- If desired, use different colors or markers to highlight or emphasize specific causes or branches.
Remember, the fishbone diagram is a visual tool designed to facilitate analysis and discussion. It can be modified and refined based on new insights or additional information. The ultimate goal is to use the diagram as a guide for problem-solving and finding effective solutions when we deal with different water bottle producing problems.
5. What are the key points for making a fishbone diagram?
In order to make most use of this quality management tool in the water bottle quality management, there are several points needing our attention while drawing:
- When identifying major factors (big bones), on-site operations generally start with the “human-machine-material-method-environment” At the same time, management-related issues are generally categorized as “personnel, time, location, and equipment.” The specific situation should determine the approach.
- Major factors must be described using neutral terms (without indicating good or bad). Medium and small factors should be assessed using value judgments (e.g., defects, shortcomings).
- Make every effort to identify all possible causes comprehensively while brainstorming. Never limit yourself only to what you can fully control or is currently executing. For analyzing human-related factors, it is preferable to focus on actions rather than attitudes or thoughts.
- There is a direct cause-problem relationship between medium factors and characteristic values, as well as between small factors and medium factors. Small factors should be analyzed until actionable solutions can be directly implemented.
- If a certain cause can be attributed to two or more factors simultaneously, the one with the strongest correlation should be considered (If necessary, consider the Three Present Principles, that is, inspect the current situation, visit the site, and compare relative conditions to identify the most relevant factors).
- When selecting significant causes, the number should not exceed seven, and they should be marked at the end of the causal chain.
6. How to make a fishbone diagram for water bottle quality management?
In this part, we will show you the actual use of a fishbone diagram in the water bottle management. Here is an example about how we use cause-and-effect fishbone diagram to deal with water bottle leaks. To avoid repetition, we will represent steps briefly in the following part:
Step 1: Analysis
Just as the tips taught above, we gather our engineer team and employees to have a brainstorming. Then we analyze the potential reasons for water bottle leaks from man, method, material, machine and environment as follows:
Man
- Inadequate Training: Insufficient training provided to workers on proper assembly techniques and sealing methods.
- Inefficient Operation: Workers not following efficient and standardized procedures during the assembly and sealing processes.
- Lack of Attention: Negligence or lack of focus on quality control during production, leading to potential leaks.
Machine
- Equipment Failure: Failure or breakdown of machinery used in the manufacturing process, which can result in improper sealing or assembly.
- Machinery Malfunction: Malfunctioning or incorrectly calibrated machinery that may lead to defects in the sealing process.
- Calibration: Lack of proper calibration of equipment, resulting in inaccurate measurements or incorrect sealing.
Material
- Poor Quality Material: Usage of low-quality materials that are more prone to leakage.
- Inadequate Material Selection: Choosing materials that are not suitable for the specific requirements of water bottle production.
- Inappropriate Material: Using materials that are incompatible with the manufacturing process or have unfavorable properties for sealing.
Method
- Improper Manufacturing Processes: Inefficient or improper techniques used during the manufacturing process, leading to faulty sealing.
- Inefficient Processes: Processes that are not optimized for maximum efficiency, potentially causing inconsistencies in sealing.
- Lack of Standard Operating Procedures: Absence of clear and standardized procedures for assembly, sealing, and quality control.
Environment
- Temperature Variations: Extreme temperature changes during production or storage that can affect the integrity of seals.
- Humidity Conditions: Excessive moisture or humidity levels that can compromise the sealing effectiveness.
- Contamination of the Bottle: Introduction of foreign particles or contaminants during the manufacturing process or storage.
Step 2: Fishbone diagram drawing
As for drawing tools, we use a online platform. Fish head is the problem “water bottle leaks”, five bones the potential factor “man, method, material, machine and environment”. After drawing the skeleton, we use neutral phrases to complement major factors, then middle and small factors. The final job is presented as follows:

Here is an example of fishbone diagram analysis for water bottle leaks
Step 3: Take actions to solve potential problems
As soon as we make up all the potential reasons for water bottle leaks, we will take corresponding measures based on different factors.
Man
- Provide proper training on assembly, sealing, and quality control.
- Implement standard operating procedures and ensure adherence.
- Emphasize attention to detail and the importance of quality control.
Machine
- Perform regular maintenance and inspections to prevent failures.
- Ensure proper lubrication and calibration for accurate measurements.
- Establish a preventive maintenance schedule.
Material
- Source high-quality materials designed for water bottle production.
- Conduct thorough material selection processes for compatibility.
- Implement strict quality control measures.
Method
- Optimize manufacturing processes for efficient and consistent sealing.
- Develop and enforce standard operating procedures.
- Continuously improve processes through evaluation and feedback.
Environment
- Control temperature and humidity to minimize impact on sealing.
- Implement proper storage practices to avoid extreme conditions.
- Maintain a clean, contamination-free environment.
7. Conclusion
For KingStar, the fishbone diagram is a valuable tool for understanding and resolving quality issues in water bottle manufacturing. By systematically analyzing the root causes and implementing effective solutions, we ensure the production of high-quality and reliable insulated water bottles.
KingStar, a leading vacuum insulated stainless steel water bottle manufacturer in China, struggles to provide high-quality water jugs for custom with custom services. For more information, please contact us! If you want more information, please contact us.

Specializing in custom manufacturing, quality control and marketing of vacuum-insulated drinkware and coolers.